An OT security risk assessment translates technical findings (assets, exposures, vulnerabilities, and threat scenarios) into business outcomes such as safety risk, production downtime, quality loss, environmental impact, and regulatory consequences. The most effective approach is scenario-based: define critical processes, map OT zones/conduits, identify credible threat pathways (including supplier remote access), estimate likelihood using exposure and control strength, quantify consequence using operational impact ranges, then rank risks in a register with clear owners and mitigation plans tied to business KPIs (e.g., reduced downtime minutes, improved recovery time, fewer high-risk vendor pathways).
Why OT risk assessment is different from IT (and why it matters)
Many organizations start OT security risk assessment using IT playbooks: vulnerability counts, patch SLAs, and generic risk questionnaires. Those inputs matter—but they don’t answer the question executives actually care about:
“What could happen to the business if our operations technology is compromised?”
OT environments differ from IT in ways that change both how you assess risk and what “impact” means:
- Availability and safety dominate. In OT, the worst day isn’t “data exfiltration”—it’s loss of control, physical damage, safety incidents, and prolonged downtime.
- Change is expensive. Patching, scanning, or adding security agents can disrupt production and require validation.
- Legacy is normal. Unsupported OSes, vendor-managed appliances, and embedded devices are common.
- Access patterns are unique. OEMs and integrators often require remote access that becomes a permanent pathway if not controlled.
- Risk propagation is different. An attacker doesn’t need to compromise every device; they need the right path to the right function (engineering access, control logic, safety systems, recipe management).
A mature OT security risk assessment therefore isn’t just a technical report. It’s a decision-making system that prioritizes scarce engineering and downtime windows against the risks that actually move business outcomes.
The goal: convert technical risk into business impact
“Technical risk” is what engineers see:
- exposed services
- weak remote access
- poor segmentation
- shared accounts
- unverified updates
- flat networks
- unmonitored engineering workstations
“Business impact” is what leadership funds:
- downtime minutes and lost throughput
- safety exposure and incident potential
- environmental and compliance impact
- quality losses and scrap
- recovery time and reputational damage
Your assessment must build a bridge between those worlds.
The bridge: credible scenarios + quantified consequences
A good OT risk assessment answers:
- What is the credible scenario?
Example: “Vendor remote access credentials are compromised; attacker uses jump path to engineering workstation; modifies PLC logic; causes process instability.” - How could it happen here?
You tie the scenario to your zones, conduits, access methods, controls, and operational realities. - What would it cost (in business terms)?
Not just “high impact,” but ranges: downtime hours, safety severity category, recovery effort, quality impacts, regulatory triggers. - What do we do first?
A prioritized roadmap that reduces the top risks with feasible changes.
What to measure: the “5 business impacts” of OT cyber risk
To translate OT cyber risk into business language, consistently map scenarios to impact categories. A practical set is:
- Safety impact
Potential for injury or loss of life; degradation of protective functions; loss of alarms or interlocks. - Production / availability impact
Unplanned downtime; reduced throughput; inability to operate; manual mode operations. - Quality impact
Scrap, rework, out-of-spec product, recalls, or batch rejection. - Environmental impact
Releases, spills, emissions exceedances, and cleanup costs. - Compliance / legal / contractual impact
Regulatory reporting, audits, penalties, customer contracts (SLAs), and litigation exposure.
Optional sixth category if you need it: financial fraud / theft (e.g., altered metering, manipulated production reporting). But for most OT programs, the five above cover what matters.
Two assessment styles: control-based vs scenario-based (use both)
Control-based assessment (good for baseline maturity)
You evaluate “do we have the controls” (segmentation, MFA, logging, backups, change control, etc.). This is helpful to:
- benchmark maturity across sites
- map to standards (e.g., IEC 62443-aligned programs)
- identify missing foundational capabilities
Limit: It can produce a long list of “gaps” without telling you which ones actually threaten your most critical processes.
Scenario-based assessment (best for business impact)
You identify credible attack paths and failure modes and quantify consequences.
Strength: It prioritizes what matters: a small number of scenarios often dominate risk.
Best practice: Do both—controls to build the foundation, scenarios to drive prioritization and funding.
The OT Risk Assessment lifecycle (a practical 8-step method)
Use this 8-step approach to produce a business-ready risk register and a mitigation roadmap.
- Define scope around critical processes, sites, and consequences
- Inventory assets that matter to those processes
- Map zones and conduits (how access and data flows)
- Identify threat scenarios tied to real pathways
- Score likelihood using exposure + control strength
- Quantify consequence in business terms
- Calculate and rank risk in a register with owners
- Plan mitigations that reduce top risks fastest
Step 1: Define scope using processes and consequences (not subnets)
Avoid the common trap: “Our OT risk assessment scope is the OT VLANs.”
A better scope statement is:
- which sites (or plant areas)
- which critical processes (lines, units, trains)
- which functions (control, safety, quality, remote access, historian, recipe management)
- which time horizon (next 12–18 months)
- what you will exclude (and why)
Scope questions that work in OT
- What processes would cause the greatest harm if disrupted for 8 hours? 24 hours? 7 days?
- Which systems would be hardest to rebuild (engineering workstations, domain services, historians)?
- Where do we rely on vendors for recovery?
- Where do we have single points of failure?
Output of Step 1: a clear statement of “what’s in” and “what’s out,” agreed by OT operations and leadership.
Step 2: Build an OT asset inventory you can trust
You cannot assess risk on unknown assets. But you also don’t need perfection to start.
What “inventory” means for OT risk assessment
At minimum, inventory should capture:
- asset name, function, location/site/zone
- system type (HMI, SCADA server, historian, EWS, PLC, IIoT gateway, switch/firewall)
- owner (OT, IT, vendor) and support model
- connectivity (what it talks to; remote access paths)
- criticality to process (high/medium/low) and recovery difficulty
- authentication method (local accounts, AD, vendor-managed)
- backup status and rebuild notes
Don’t forget “invisible” assets
OT risk is often dominated by:
- engineering workstations (EWS)
- remote access gateways/jump hosts
- OT identity infrastructure (AD, local credential stores)
- backup repositories and golden images
- unmanaged switches and serial/Ethernet converters
- vendor appliances and “black box” PCs
Output of Step 2: a usable inventory for the scoped environment, even if incomplete—plus a plan to improve accuracy over time.
Step 3: Map zones, conduits, and “crown jewel” functions
Risk is about pathways. Pathways are defined by:
- zones (groupings of assets with similar trust and function)
- conduits (controlled communications paths between zones)
A practical zone model (simple but effective)
- Enterprise IT zone (business systems)
- OT DMZ (brokers, historians interfaces, remote access termination)
- Operations / SCADA zone (SCADA servers, operator HMIs)
- Engineering zone (EWS, project servers, code repositories)
- Cell/Area zones (machine networks, PLCs, drives, robots)
- Safety-related zone (if applicable; treat as highest sensitivity)
Crown jewel functions (what attackers want)
Not every asset is equally important. Many incidents hinge on control of:
- remote access pathways
- engineering capability (ability to change logic)
- operator visibility (loss of HMI/alarms)
- batch/recipe management
- time synchronization and authentication
- backups and restore capability
Output of Step 3: a zone/conduit diagram or table showing how remote access and operational data flows, plus identification of crown jewel functions.
Step 4: Identify credible threat scenarios (the heart of the assessment)
Threat modeling in OT is most useful when it stays grounded in what’s plausible.
Where OT threat scenarios commonly start
- compromised vendor credentials or supplier remote access
- phishing leading to IT compromise, then pivot to OT via weak segmentation
- malware introduced via update packages or file transfers
- compromised laptop used on-site
- exposed remote services (misconfigured remote desktop tools)
- insider misuse or accidental misconfiguration under pressure
A strong scenario format (copy/paste)
Each scenario should be written consistently:
- Scenario name
- Initial access vector (how attacker gets in)
- Pathway (zones/conduits traversed)
- Target function (what attacker wants)
- Operational effect (what changes in the process)
- Business impact category (safety/availability/quality/environment/compliance)
- Existing controls (what would stop/detect/limit it)
- Gaps (what makes it credible)
Example OT scenarios (use as a starting library)
- Vendor remote access compromise → engineering workstation access → PLC logic change
- Ransomware in IT → lateral movement to OT via shared identity services → HMI/SCADA outage
- Unverified update package → malicious code on HMI → loss of view / manipulated alarms
- Compromised IIoT gateway → pivot into OT cell network → intermittent process disruption
- Backup repository compromise → restore blocked → extended downtime
- Flat network + shared local admin → rapid propagation → widespread OT workstation lockout
Output of Step 4: a shortlist of 10–25 scenarios for the scoped environment, with strong ties to real pathways.
Step 5: Score likelihood without pretending you can predict attackers
Likelihood is tricky. Instead of guessing “how likely attackers will choose us,” estimate how feasible the scenario is given current exposure and controls.
A practical likelihood model for OT
Define likelihood as a function of:
- Exposure (how reachable the target is, how many pathways exist)
- Control strength (how strong preventive/detective controls are)
- Complexity (how hard the attack chain is to execute reliably)
- Threat prevalence (is this a common technique in the wild)
Use a 1–5 scale for each factor and compute:
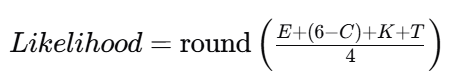
Where:
- E = Exposure (1 low, 5 high)
- C = Control strength (1 weak, 5 strong)
- K = Kill-chain complexity (1 hard, 5 easy)
- T = Threat prevalence (1 rare, 5 common)
This formula intentionally makes likelihood higher when controls are weaker by using (6−C).
How to score Exposure (E) quickly
- 1: No remote path; strong segmentation; physical-only with strict controls
- 3: Some remote access exists but brokered; limited conduits; monitored
- 5: Direct remote access to OT zones; flat networks; many unmanaged pathways
Output of Step 5: consistent likelihood scoring across scenarios—defensible, repeatable, and easy to explain.
Step 6: Quantify consequence in business terms (downtime, safety, quality)
This is where OT risk assessment becomes executive-ready.
Consequence should be scenario-specific
A vulnerability’s consequence depends on where it lives. “Outdated Windows” on a lab PC is not the same as “outdated Windows” on the only engineering workstation.
Build a consequence model with 5 business impact categories
Score each category on 1–5 (or 1–4) and compute an overall consequence.
Example 1–5 definitions (adjust to your organization):
- Safety (S)
1: No safety impact
3: Potential for minor injury / safety margin reduction
5: Potential for serious injury/fatality or major protective function compromise - Availability (A)
1: <1 hour disruption
3: 8–24 hours disruption
5: >7 days or multi-site disruption - Quality (Q)
1: No product impact
3: batch/lot rework or measurable scrap
5: recall/large batch loss/customer impact - Environmental (En)
1: none
3: reportable near-miss or minor release
5: major reportable release, cleanup, community impact - Compliance/Legal (L)
1: internal policy only
3: contractual breach or audit finding
5: regulatory enforcement action / major legal exposure
Compute overall consequence as a weighted sum:
Consequence=3S+2A+Q+En+L
Why weight safety and availability higher? Because in many OT environments those dominate business risk. If your vertical is quality-dominant (e.g., pharma), you may weight Q higher.
Output of Step 6: consequence scores that speak the language of operations and executives.
Step 7: Calculate risk and build a board-ready risk register
Risk calculation (simple and explainable)
Use:
RiskScore=Likelihood×Consequence
If you used 1–5 likelihood and the consequence formula above, risk scores will naturally spread.
Define risk bands for decision-making
For example:
- Critical: RiskScore≥70 (requires leadership attention and funded plan)
- High: 45≤RiskScore<70
- Medium: 25≤RiskScore<45
- Low: RiskScore<25
The point isn’t perfect math—it’s consistent prioritization.
What makes a risk register “board-ready”
A board-ready OT risk register is not a spreadsheet full of CVEs. It includes:
- scenario name (plain language)
- business impact summary (downtime, safety category, etc.)
- current controls and gaps
- risk owner (named leader)
- mitigation plan with milestones
- residual risk estimate after mitigation
- dependencies (downtime windows, vendor support, budget)
Output of Step 7: a risk register that drives decisions, not debate.
Step 8: Turn findings into a prioritized mitigation roadmap
Once you have ranked risks, the next question is: what do we do first that actually reduces risk quickly?
Prioritize mitigations by “risk reduced per unit effort”
Add an effort score Ef (1–5), then compute:

This prevents the roadmap from being dominated by multi-year projects if there are high-impact quick wins.
High-leverage OT mitigations (often top performers)
These commonly reduce multiple scenarios at once:
- Secure vendor remote access (OT DMZ, jump host, MFA, JIT, session recording)
- Segmentation improvements (zones/conduits, deny-by-default rules)
- Identity hardening (remove shared accounts, limit local admin, PAM patterns)
- Backup and recovery hardening (immutable backups, offline copies, restore testing)
- Engineering workstation protection (application allowlisting, controlled toolchain, monitored changes)
- Monitoring for high-signal OT events (vendor sessions, PLC downloads, new admin tools)
Output of Step 8: a roadmap that shows what you’ll do in the next 30/60/90 days and the next 6–18 months—with clear ownership.
Worked example: turning “vendor VPN” into dollars and downtime
Here’s how a technical finding becomes a business risk statement.
Technical finding
“An OEM has a persistent VPN connection that terminates inside the SCADA zone. Shared vendor credentials are used. No MFA. No session recording.”
Scenario definition
- Initial access: attacker compromises vendor credentials (phishing/credential reuse)
- Pathway: VPN → SCADA zone → engineering workstation reachable via flat access
- Target function: engineering capability and operator visibility
- Operational effect: attacker disrupts HMI visibility and changes PLC setpoints
- Business impact: production downtime + potential safety margin reduction
Likelihood scoring (example)
- E=5 (direct access into SCADA zone)
- C=1 (weak controls: shared creds, no MFA, no recording)
- K=4 (straightforward pathway)
- T=5 (vendor credential compromise is common)

Consequence scoring (example)
- S=3 (potential safety margin reduction; not necessarily catastrophic)
- A=4 (likely 24–72 hours disruption depending on recovery)
- Q=3 (scrap/rework likely)
- En=1 (no direct environmental impact expected)
- L=2 (audit/contract impact possible)
Consequence=3(3)+2(4)+3+1+2=9+8+3+1+2=23
Risk score
RiskScore=5×23=115
That lands well into “Critical” in most banding schemes.
Translate to business impact (plain language)
“If OEM remote access is compromised, an attacker could disrupt operations and manipulate control settings, causing 1–3 days of downtime, scrap/rework, and elevated operational safety exposure.”
Mitigation plan (risk-reducing controls)
- Terminate OEM access in OT DMZ only
- Require named accounts + MFA
- Implement JIT access windows
- Broker sessions through jump host with session recording
- Restrict conduits from jump host to allowlisted targets only
- Quarterly access review and rapid offboarding
This mitigation reduces multiple variables at once: exposure E drops, control strength C rises, complexity K drops for attackers.
Templates: OT risk register, scenario worksheet, and interview questions
Below are copy/paste templates you can adapt for iotworlds.com readers.
Template 1: OT scenario worksheet
Use one worksheet per scenario.
- Scenario ID:
- Scenario name:
- Site / line / unit:
- Initial access vector: (vendor access, IT pivot, removable media, exposed service, insider)
- Threat actor profile (optional): (criminal, insider, hacktivist, etc.)
- Attack pathway (zones/conduits):
- Target function: (engineering, HMI visibility, safety, recipes, backups)
- Operational effect: (downtime, unsafe state risk, quality drift, loss of alarms)
- Existing controls: (MFA, segmentation, monitoring, backups, change control)
- Control gaps:
- Likelihood factors: E,C,K,T
- Consequence factors: S,A,Q,En,L
- Risk owner:
- Mitigation actions:
- Dependencies: (downtime window, vendor coordination, procurement)
- Residual risk estimate (after mitigation):
Template 2: OT risk register (table)
| Scenario | Site/Process | Likelihood (1-5) | Consequence | RiskScore | Business Impact Summary | Owner | Mitigation | Target Date | Residual Risk |
|---|
Tip: Keep “Business Impact Summary” to 1–2 lines using ranges, e.g., “8–24h downtime; moderate quality loss; low environmental exposure.”
Template 3: OT interview questions (operations + engineering + IT)
For Operations
- What failures stop production fastest? Which take longest to recover?
- Which alarms or operator views are essential to safe operation?
- What’s the acceptable downtime threshold before major business impact?
- Which processes are most sensitive to recipe or setpoint changes?
For Controls / Engineering
- Who can download logic to PLC/DCS today?
- Where are project files stored? How are they backed up?
- What remote support tools are used (and by whom)?
- What changes are made during outages that bypass normal change control?
For OT Networking / Infrastructure
- Where does vendor access terminate?
- Do we have an OT DMZ? What’s inside it?
- Which conduits exist between IT and OT and why?
- What logs do we collect from remote access and jump hosts?
For Cybersecurity
- What detections exist for vendor access misuse?
- How quickly can we disable vendor access across sites?
- Are backups protected from ransomware (immutability, offline copies)?
- What’s the incident response plan for OT-specific scenarios?
KPIs that prove risk reduction (not just activity)
If your program is working, you should be able to show measurable movement in the risk drivers.
Executive KPIs (business-oriented)
- Unplanned OT downtime minutes attributable to cyber events (trend down)
- Time to revoke vendor access (median time, target hours/days not weeks)
- Time to restore critical OT services (RTO improvements via tested backups)
- % of critical processes covered by scenario-based risk assessment
- # of critical risks with funded mitigation plans (and completion rate)
Control KPIs (risk-driver oriented)
- % of vendor remote access terminating in OT DMZ
- % of vendor accounts named + MFA enabled
- % of vendor access that is time-bound (JIT)
- # of shared accounts in OT (target: 0)
- % of engineering workstations monitored and backed up
- # of “flat network” segments remaining in critical areas
- Quarterly access review completion rate (Tier 1 suppliers)
Common mistakes and how to avoid them
Mistake 1: Treating CVSS as business risk
CVSS helps prioritize patching, but it doesn’t capture OT consequence. Fix by using scenarios tied to processes.
Mistake 2: Focusing only on PLC vulnerabilities
Many OT incidents involve IT-like assets: Windows HMIs, historians, remote access, identity services, backups. Assess the whole pathway.
Mistake 3: Trying to inventory everything before starting
Start with critical processes, then iterate. A partial inventory that’s accurate is better than a perfect inventory that never arrives.
Mistake 4: Ignoring recovery in the risk equation
In OT, resilience is risk reduction. Tested restores, golden images, and documented rebuild steps can reduce consequence dramatically.
Mistake 5: Writing a report with no owners and no dates
A risk register without ownership is just documentation. Assign owners, deadlines, and dependencies.
Mistake 6: Not including vendors in the model
Supplier pathways are frequently the highest-likelihood initial access route. Explicitly model vendor remote access and update delivery.
30/60/90-day plan to launch an OT risk program
First 30 days: establish the foundation
- Agree on scope (sites/processes) and business impact categories
- Build a minimum viable asset inventory for scoped areas
- Map remote access pathways and zone/conduit boundaries
- Draft an initial scenario library (10–15 scenarios)
- Run stakeholder interviews and validate “what would really hurt”
Deliverable: a credible draft risk register for the top risks.
Days 31–60: score and prioritize
- Score likelihood and consequence consistently across scenarios
- Quantify downtime and recovery ranges with operations input
- Identify top 5–10 risks and propose mitigations
- Estimate effort and compute PriorityIndex=RiskScore/Ef
- Align mitigations with planned outages and project windows
- Deliverable: prioritized mitigation roadmap with owners and milestones.
Days 61–90: start reducing risk and proving progress
- Implement quick wins that reduce multiple scenarios:
- vendor access hardening
- removal of shared accounts
- segmentation “top conduits” tightening
- backup hardening + restore tests
- Define KPIs and reporting cadence
- Run a tabletop exercise for a top scenario (e.g., vendor access compromise)
Deliverable: measurable reduction in top risk drivers plus an operating rhythm.
FAQ
What is the best framework for OT security risk assessment?
The most effective approach is scenario-based, using zones/conduits and critical process functions. Combine that with control-based maturity checks to ensure foundational capabilities (remote access control, segmentation, identity, backups, monitoring) exist.
How do you quantify OT cyber risk in business terms?
Use consequence categories—safety, availability, quality, environmental, compliance—and score scenarios with downtime and recovery ranges. Convert the highest risks into business statements like “24–72 hours downtime” and “batch loss potential,” not just “critical vulnerability.”
Should we use Risk=Likelihood×Impact for OT?
Yes, as a simple and explainable starting point. The key is to score likelihood based on exposure and control strength (not guesswork) and to quantify impact in OT business categories.
What should be the first priority in most OT risk programs?
Secure remote access and supplier pathways often produce the largest immediate risk reduction: OT DMZ termination, MFA, named accounts, just-in-time access, allowlisting, and session logging/recording.
How often should we redo an OT risk assessment?
At least annually for critical sites, and whenever major changes occur: new vendor access methods, major upgrades, new lines, segmentation changes, or significant incidents.